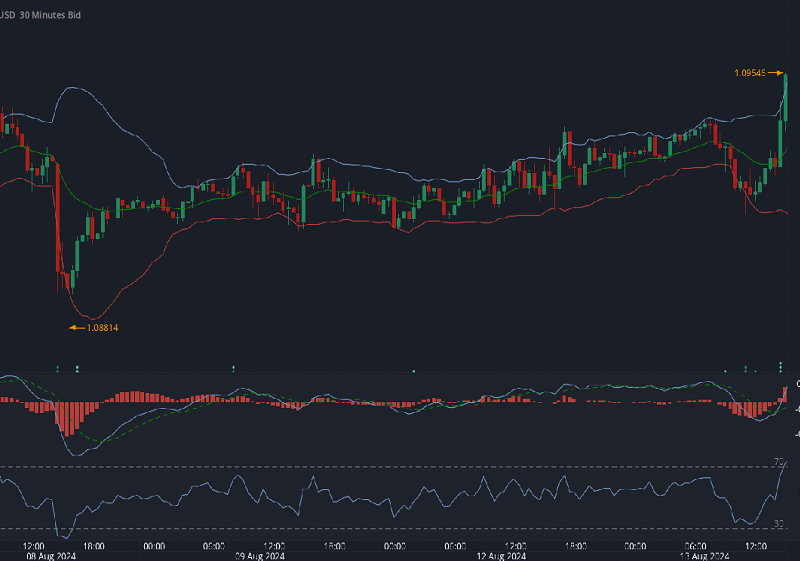
In the world of trading, technical indicators are like a compass. They help traders make sense of market movements, identify patterns, and determine entry and exit points. However, relying on a single indicator can be misleading. Markets are complex, and no one tool can capture all the nuances. That’s why seasoned traders often combine multiple indicators to increase the reliability of their strategies.
In this article, we’ll explore how to blend indicators effectively to build a trading system that’s both robust and adaptable.
The Role of Indicators in Technical Analysis
They help traders forecast future price movements by analysing past behaviour. Some indicators are designed to signal potential turning points before they happen. These are called leading indicators. Others lag behind price action, confirming trends after they begin. These are known as lagging indicators.
Understanding the distinction is important. Leading indicators, like the Relative Strength Index (RSI), can help anticipate reversals, while lagging indicators, such as moving averages, confirm the presence and direction of a trend. The problem arises when traders rely solely on one type, which can lead to missed opportunities or false signals.
When multiple tools provide overlapping information, it creates redundancy rather than confirmation. The real skill lies in selecting a complementary set of indicators that serve different purposes within a cohesive strategy. For further information, see more here.
Benefits of Combining Indicators
One of the primary advantages is the ability to cross-confirm signals. When different types of indicators all point in the same direction, it adds weight to a trade decision. For instance, if a trend indicator shows upward momentum and a momentum indicator suggests the asset is not yet overbought, the odds of a successful long trade increase.
Timing is another area where combinations shine. While one indicator may alert you to a potential trend, another can refine the timing of your entry or exit. This can reduce slippage and improve trade efficiency. Moreover, combining indicators can serve as a form of risk management by filtering out weak or conflicting signals.
Ultimately, the goal is to create a strategy that is more than the sum of its parts—one that helps traders make better-informed decisions and avoid the pitfalls of emotional or impulsive trading.
Core Categories of Indicators
To build a balanced trading system, it’s useful to understand the primary categories of indicators and what each brings to the table. Trend-following indicators, like Moving Averages, MACD (Moving Average Convergence Divergence), and the Average Directional Index (ADX), help determine the overall direction of the market. They are excellent for identifying whether you should be looking for long or short positions, or staying on the sidelines altogether.
Momentum indicators, such as the RSI, Stochastic Oscillator, and Commodity Channel Index (CCI), assess the strength of price movement. They are particularly helpful in identifying overbought or oversold conditions, which can precede reversals.
Volume indicators, like On-Balance Volume (OBV) and the Chaikin Money Flow, provide insights into the strength behind price moves. Rising prices on increasing volume tend to indicate genuine buying interest, while declining volume might signal a weakening trend.
The Golden Rule: Non-Redundancy in Combination
When combining indicators, the biggest mistake to avoid is redundancy. Using several indicators that essentially tell you the same thing creates an illusion of confirmation. For example, pairing the RSI with the Stochastic Oscillator may seem logical, but both are momentum indicators. While they use different formulas, they often generate similar signals. This can lead to overconfidence in a trade setup that isn’t truly backed by diverse data.
This way, each tool brings unique information to the table. A trend indicator might suggest a direction, a momentum indicator can assess the strength of that move, and a volatility indicator can help manage risk. When each component plays a distinct role, the strategy becomes more reliable and less prone to false positives.
Popular Indicator Combinations That Work
One effective combination is the Moving Average with the RSI. The Moving Average helps identify the prevailing trend, whether it’s upward, downward, or sideways. RSI, on the other hand, reveals whether the asset is overbought or oversold. This duo works well for trend-following strategies, allowing traders to enter when the trend aligns with favourable momentum conditions.
ADX tells you if a trend is strong enough to trade, while Parabolic SAR provides dynamic stop-loss levels.
Conclusion
It requires an understanding of each tool’s purpose and how they can work together to form a coherent trading plan. When done right, the synergy between trend, momentum, volatility, and volume indicators provides a multi-dimensional view of the market that no single tool can offer alone.
Whether you’re a new trader or looking to refine your current approach, building a strategy based on well-chosen indicators can lead to more consistent and confident decision-making.

